 Breaking
The AI Unwind and the Great Rotation: Semiconductors Fall for Eight Straight Sessions, the Longest Streak Since 2008 — Where Is the Money Going?


US equities closed the week on October 16, 2026. The keyword for the week was not “record high” but “rotation”.
At the close, the S&P 500 fell 1.09% to 7,659.44, down 1.95% for the week; the Nasdaq dropped 2.15% to 26,140.03, a weekly loss of 4.48% that matched the S&P for the worst weekly decline in nearly four months. Yet the Dow Jones Industrial Average slipped only 0.34% to 52,002.41 and actually gained 0.67% on the week — its second consecutive weekly advance. Within one market, the indices traced opposite paths.
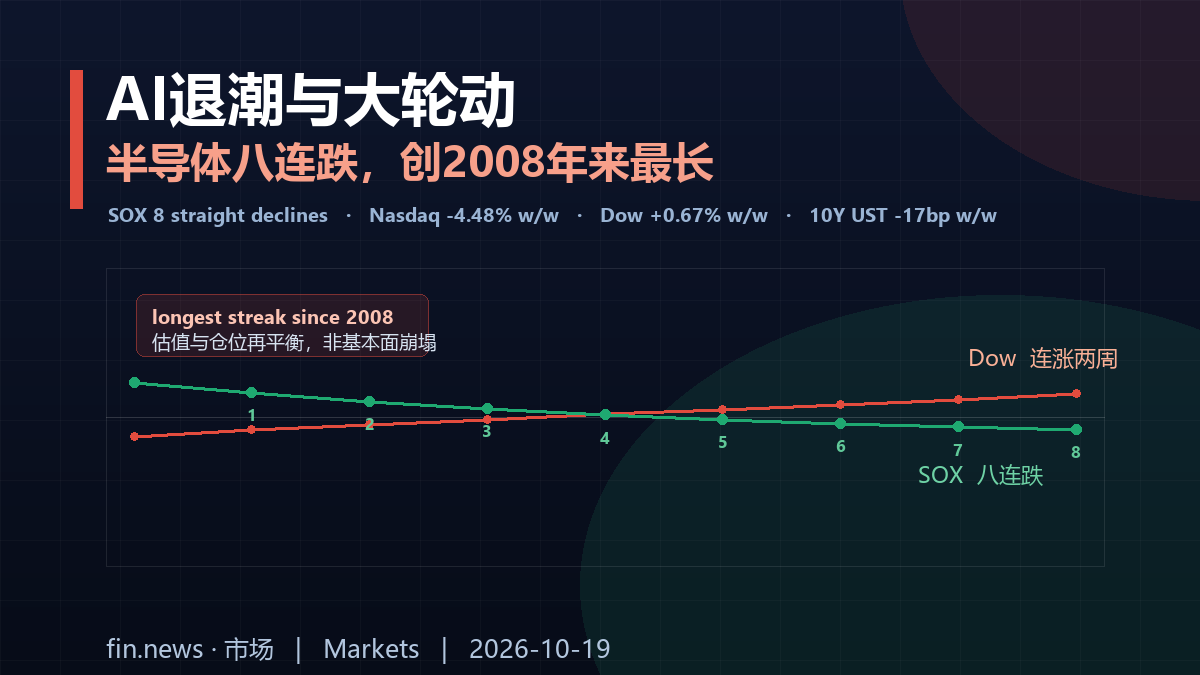
The signal inside the structure is even starker: the Philadelphia Semiconductor Index recorded an eighth consecutive decline, its longest losing streak since the 2008 financial crisis. The AI supply chain bore the brunt — CoreWeave fell about 25% on the week, SanDisk nearly 20%, Dell more than 20%, Oracle nearly 5%, SK Hynix 6.58% and Arm 6.94%. Apple, by contrast, rose against the tide to a record high.
On one side, the longest semiconductor losing streak since the crisis. On the other, semiconductor output up nearly 20% year on year. That contradiction is the key to understanding global asset pricing right now.
1. The Week in Review: Indices Diverge, Semiconductors Fall for Eight Sessions
Unpacked, the contrast is clear. The Nasdaq — home to the core assets of the AI narrative — fell 2.15%, while the blue-chip Dow slipped just 0.34%. For the full week the Nasdaq lost 4.48% and the S&P 1.95%, while the Dow rose 0.67%. “AI trading worries crush US stocks” became the dominant explanation, and the reallocation triggered by the AI selloff pushed the Dow into the role of safe haven.
The semiconductor losses were especially concentrated. The Philadelphia Semiconductor Index fell for eight straight sessions, a run unmatched since the 2008 financial crisis. At the stock level, CoreWeave closed down 11.91% and about 25% for the week; SanDisk fell 6.85% and nearly 20% on the week; Coherent dropped more than 7%; Dell lost more than 20% on the week; Oracle fell 4.64%, SK Hynix 6.58% and Arm 6.94%; Tesla shed 2.13%. The Nasdaq Golden Dragon China Index fell 1.3%, with Baidu down 2.93% and Alibaba down 1.83%.
The one exception was Apple, which rose against the tide to a record high on exceptionally strong pre-order demand for its foldable iPhone. That detail matters: capital is not abandoning technology indiscriminately. It is re-ranking AI capital-spending narratives against end-consumer demand.
2. The Starkest Contradiction: Output Up Nearly 20%, Prices Down Eight Sessions
On industry data alone, semiconductors look nothing like a sector in trouble. US September manufacturing output rose 0.3% month on month and total industrial production 0.7%, the largest increase in five months; semiconductor output rose more than 2% month on month and nearly 20% year on year. Production, orders and capacity utilisation are all improving.
But equities never price current output; they price the discounted value of future cash flows. With the discount rate above 5% and AI infrastructure requiring hundreds of billions of dollars of continuous capex, the market’s tolerance for “when does the spending become profit” narrows sharply. Bundesbank President Nagel, speaking in Bangkok, offered an official footnote: recent bond-market volatility reflects a combination of high inflation, resilient growth and rising capital demand from AI companies.
In other words, AI is no longer only a source of valuation — it has also become one of the drivers of higher rates. When a narrative simultaneously demands enormous financing and pushes up its own cost of capital, its share price becomes far more sensitive to any skeptical report. That explains why highly leveraged compute lessors such as CoreWeave fell far more than cash-rich leaders such as Nvidia: this selloff has progressed along the gradient of balance-sheet strength.
3. Treasury “Safe-Haven Buying”: Yields Down 17bp on the Week, But Not Because of Easing
The week’s most misread signal came from the bond market. The 10-year Treasury yield finished near 5.07%, marginally higher on the day but down about 17 basis points for the week — its best weekly performance in more than a year. The 2-year stood at 4.706%, down about 8bp on the week, and the 30-year at 5.422%.
Falling yields are usually read as rising rate-cut expectations, but the driver was different this time. Fed Chair Warsh declined in Friday’s remarks to offer clues on future rate decisions, and the market-implied probability of an October hike duly fell below 15% — a genuine contribution to the move. But the larger bid came from safe-haven demand triggered by the AI pullback: equity investors trimmed AI exposure and parked the proceeds in Treasuries.
The distinction is crucial. If falling yields were driven by easing expectations, equity valuations should benefit in tandem. If they are driven by haven demand, it means bonds have become the hedge against risk assets again rather than their competitor. Barely two weeks after the 10-year touched 5.349% intraday on October 5 — a high since 2002 — the market swung from “rate panic” to “haven buying” within a single week, a sign that pricing currently depends on narrative switches rather than the continuous evolution of fundamentals.
4. Where the Rotation Went: The Dow’s Two-Week Run and Europe as a “Low-AI Safe Haven”
Capital left AI but did not leave the market. The first destination was value within the US. The Dow rose for a second straight week as financials and energy took over leadership, with energy directly boosted by Brent crude approaching $110 and hitting a five-month high.
The second destination is more interesting: European equities. The pan-European Stoxx 600 rose 0.72% to 644.74 on Friday, its highest close since September 8, and gained 2.09% on the week — its largest weekly advance since July 3. Germany’s DAX added 0.95%, the FTSE 100 0.35% and the Euro Stoxx 50 0.57%. The market’s rationale was blunt: low AI exposure has become a safe haven.
That would have been unthinkable over the past three years. Europe was long discounted for “lacking technology champions”; now the same trait has become a defensive attribute. The lesson: when AI shifts from growth story to source of risk, the correlation structure of assets flips, and what was once derided as “no story” becomes “no exposure”. For allocators, cross-market diversification is regaining value rather than simply rotating within US technology.
5. Cracks in Emerging Markets: Jakarta Plunges 11.57%, Worst Day Since January 1998
The third destination was cash and quality assets, and where liquidity was withdrawn, cracks appeared. On Friday, Indonesia’s Jakarta Composite Index plunged 11.57% to 5,185.11, its largest single-day fall since January 1998 and its lowest level since November 2020, triggering a trading halt intraday. The trigger was MSCI’s concern over market investability, which could lead to a rating downgrade and removal from global indices.
That story was largely buried by the AI narrative, but it reveals a broader risk: when dollar liquidity tightens at the margin and global capital actively cuts risk exposure, any market dependent on passive index flows has its volatility amplified by the “rating—weight—flow” negative feedback loop. The State Bank of Vietnam’s directive this week that commercial lenders cut rates on manufacturing and priority sectors by 1.5 to 2 percentage points, and deposit rates of six months or more by at least 0.5 points, is a defensive response under the same logic — using domestic easing to offset external drainage.
6. Two Chinese Threads: A-Shares’ “Low-AI” Structural Rally and the Yuan’s Four-Year High
Chinese assets presented two independent threads this week.
The first is a structural rally in A-shares. The Shanghai Composite rose 0.24% to 3,716.28, the Shenzhen Component fell 0.12% to 11,802.46 and the ChiNext dropped 0.39% to 2,772.38. The index level was unremarkable, but the internal rotation was violent: the low-altitude economy and defence sectors surged, while WuXi AppTec fell 6.6% and dragged on innovative drugs. The significance of that combination is that A-shares’ strongest segments happened to fall within the global preference for “low AI exposure” — the low-altitude economy and defence are anchored to policy and orders rather than the global compute capex cycle, giving them relative independence during the AI pullback. Hong Kong confirmed the pattern: the Hang Seng rose 0.52% and the Hang Seng Tech Index 1.16%.
The second is the renminbi. The dollar index fell 0.21% to 101.84, failing to reclaim 102, hitting a two-week low and posting its first weekly decline in five weeks. Offshore renminbi broke through 6.69 intraday over two sessions, setting another four-year high. Weaker dollar and stronger renminbi reflect both the cooling of hike expectations after Warsh’s remarks and a search for non-dollar, non-AI diversification amid AI turbulence. For domestic assets, currency stability preserves independent room for monetary policy — one of the most important external buffers for A-shares and bonds in the fourth quarter.
7. The Week Ahead: Four Variables Decide How Far Rotation Runs
First, whether oil holds above $110. December Brent rose 3.72% to $109.86 on Friday, a five-month high and close to $110; WTI rose 3.51% to $101.41 and 10.41% on the week. The drivers were Ukraine resuming attacks on Russian refineries and a bipartisan bill to block a US-Russia diesel supply agreement. Iran’s foreign minister said the “reopen Hormuz within seven days” proposal remains on the table, with the strait potentially reopening within six days if Washington accepts the terms. Every jump in oil rewrites both the inflation path and energy earnings.
Second, whether AI names can stop falling. Eight consecutive declines in the semiconductor index is an extreme in historical terms, but “fell a lot” is not a reason to buy. The real test is next week’s US tech earnings and guidance — whether this becomes a relief rally or a pause before a larger leg down. The answer is not in gold or crude but in technology stocks themselves.
Third, whether Treasury yields hold near 5%. Whether the 17bp weekly decline is a “peak” or a “haven spike” will directly determine whether pressure on expensive growth stocks eases. Note that yields peaking and equities bottoming are two different things.
Fourth, Europe’s political and fiscal risk. More than 2,000 people have been arrested in French unrest. More important than the headlines is the France-Germany 10-year spread: if it keeps widening, social and fiscal risk is transmitting further into financial markets, and the “European safe haven” thesis could weaken.
The conclusion: what really happened this week is not that “US stocks fell” but that the global pricing anchor is swinging back from the AI capital-spending narrative to interest rates and cash flow. In that swing, valuation dispersion will re-sort along balance-sheet strength and sensitivity to the discount rate. The implications for investors are threefold. First, do not equate “correct long-term industry trend” with “safe current valuation” — financing cost sits between the two. Second, diversification regains value, particularly across markets and across AI exposure. Third, in an environment with yields above 5%, the premium for cash-flow certainty will keep exceeding the imaginative space of growth. The rotation is not over, but its direction is now clearer than its magnitude.